
Monitor PostgreSQL® metrics with Grafana®#
As well as offering PostgreSQL-as-a-service, the Aiven platform gives you access to monitor the database. The metrics/dashboard integration in the Aiven console lets you send PostgreSQL® metrics to an external endpoint like Datadog or to create an integration and a prebuilt dashboard in Aiven for Grafana®. Get detailed information about the metrics and dashboard sections in PostgreSQL® metrics exposed in Grafana®.
Push PostgreSQL metrics to InfluxDB®, M3DB, or PostgreSQL#
To collect metrics about your PostgreSQL service you will need to configure a metrics integration and nominate somewhere to store the collected metrics.
In the Overview page of your Aiven for PostgreSQL service, go to Manage integrations and choose the Store Metrics option with Store service metrics in a time-series database as its description.
Choose either a new or existing InfluxDB®, M3DB, or PostgreSQL service.
A new service will ask you to select the cloud, region and plan to use. You should also give your service a name. The service overview page shows the nodes rebuilding, and then indicates when they are ready.
If you’re already using InfluxDB, M3DB, or PostgreSQL on Aiven, you can submit your PostgreSQL metrics to the existing service.
Warning
Although you can send metrics of your PostgreSQL service to this very service, this is not recommended since it increases the load on the monitored system. This can also result in issues with the availability of the metrics in case of problems with the service.
Provision and configure Grafana#
Select the target InfluxDB, M3DB, or PostgreSQL database service and go to its service page. Under Manage integrations, choose the Monitor Data in Grafana option to make the metrics available on that platform.
- Choose either a new or existing Grafana service.
A new service will ask you to select the cloud, region and plan to use. You should also give your service a name. The service overview page shows the nodes rebuilding, and then indicates when they are ready.
If you’re already using Grafana on Aiven, you can integrate your M3DB as an additional data source for that existing Grafana.
On the Overview page for your Aiven for Grafana service, select the Service URI link. The username and password for your Grafana service is also available on the service’s Overview page.
Now your Grafana service is connected to M3DB as a data source and you can go ahead and visualize your PostgreSQL metrics.
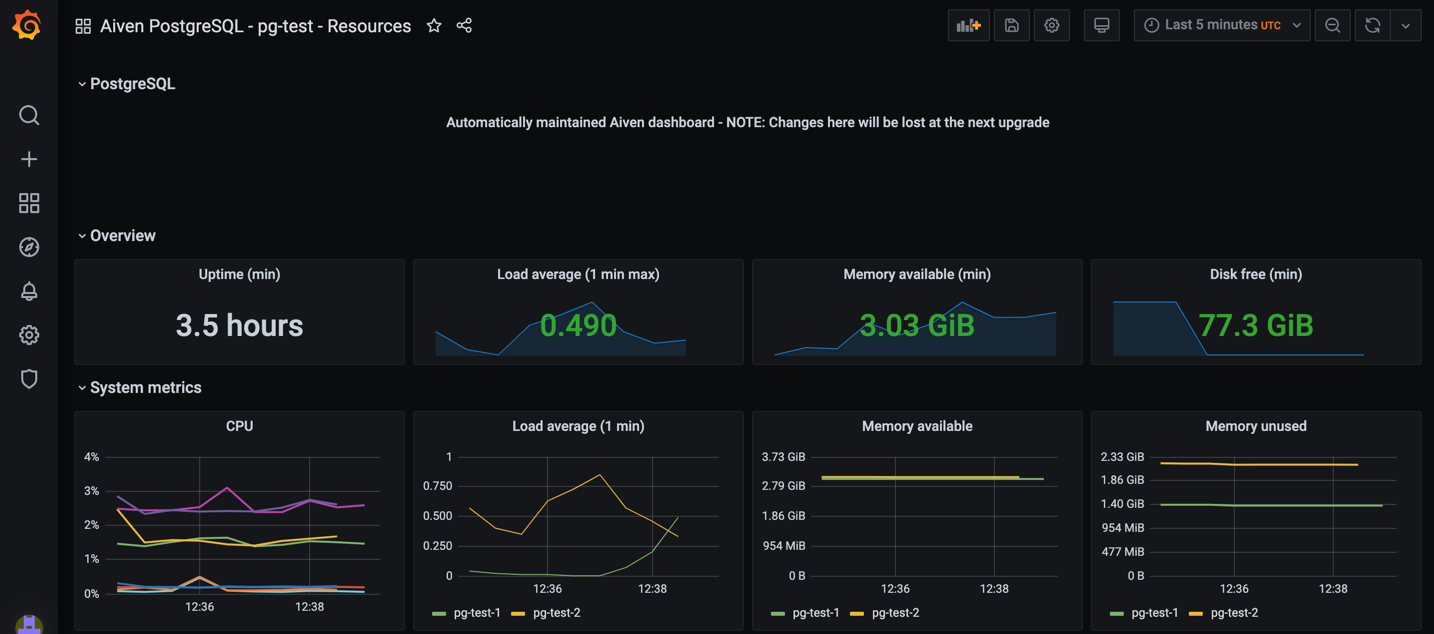
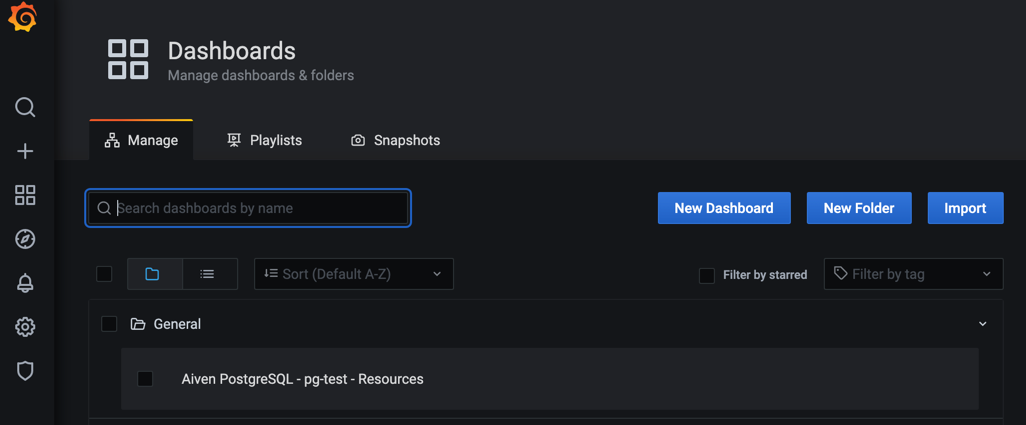
Open PostgreSQL metrics prebuilt dashboard#
In Grafana, go to Dashboards and Manage, and double click on the dashboard that bears name of the metrics database.
Browse the prebuilt dashboard or create your own monitoring views. More info about the dashboard and pushed metrics can be found at PostgreSQL® metrics exposed in Grafana®